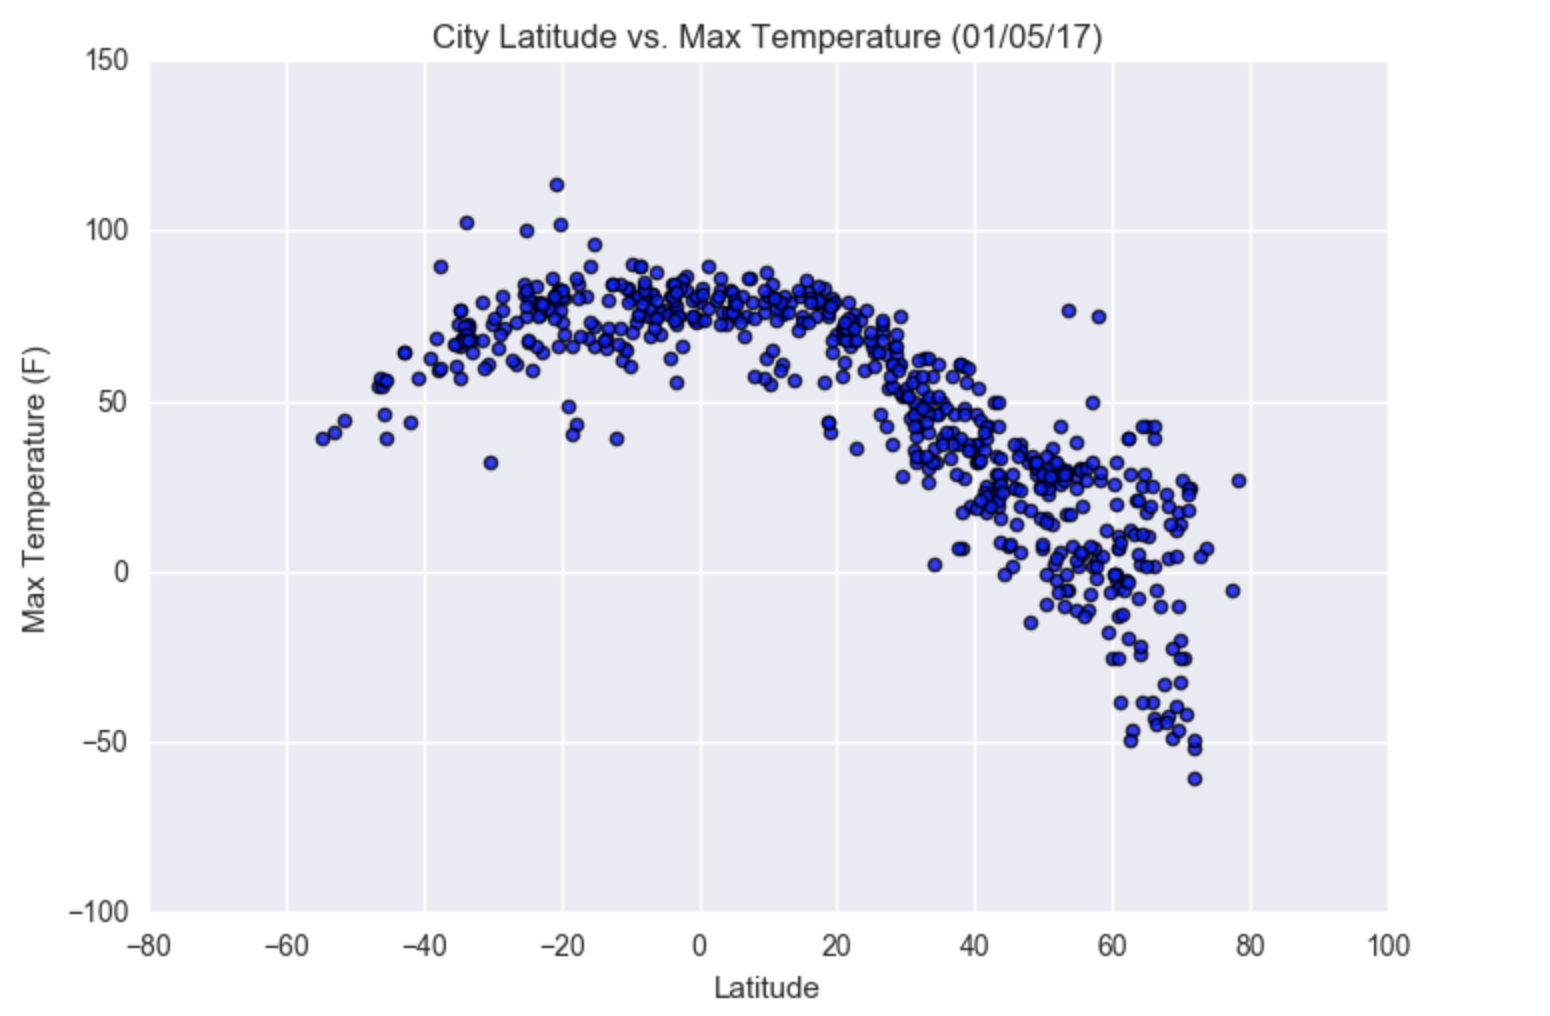
Summary: Latitude vs X

The purpose of this project was to analyze the weather based on the location from the equator. In Jupyter Notebook, I created
a list of 500+ cities using the Python library, CityPy, as it searched for the nearest cities based
on the randomly generated latitude and longitude coordinates. I used OpenWeatherMap API to pull weather
data for each city.
Through Pandas and Matplotlib, I created plots to analyze and visualize the possible correlation
between latitude and the following factors: temperature, humidity, cloudiness, and wind speed. A
variety of trends were discovered by exploring each factor.


